Measurement and growth economics

Know what your next customer really costs.

Lovelace shows what each channel's next new customer costs at today's spend, with an honest range, how long that customer takes to pay you back, and where your next dollar should go. Pixel & Shelf runs it for the brands we work with.

Starts at $1,000/month. Every engagement is scoped to your brand.

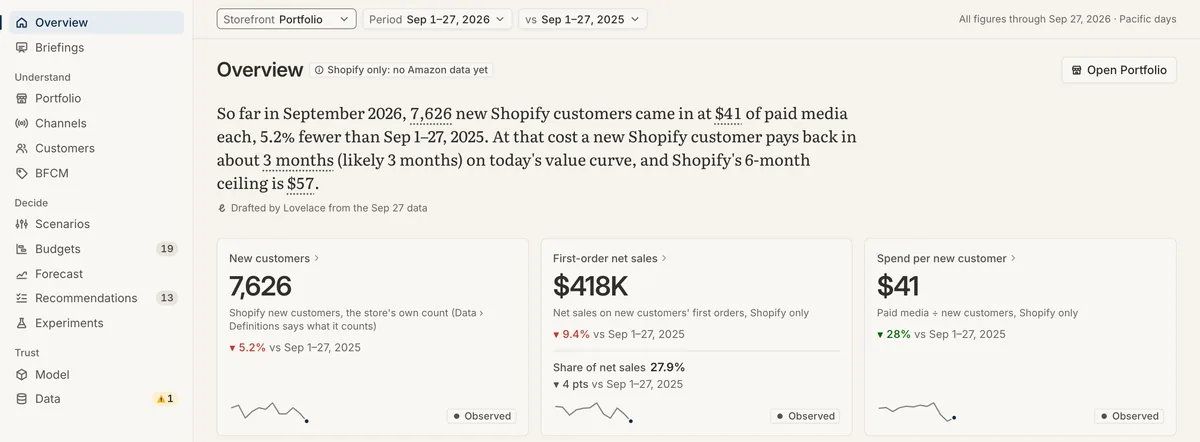
Lovelace's Overview screen for Demo Co, a synthetic brand. One drafted sentence summarizes the month: new Shopify customers, paid media per new customer, payback in about 3 months and the 6-month cost ceiling. Below it, three tiles show new customers, first-order net sales and spend per new customer, each labeled observed.
Synthetic demo data The Overview for Demo Co, a made-up brand: one sentence on where the month stands, then the numbers behind it. Scroll sideways to read it.
  • Every number has a receiptHover or tap any figure for its definition, window, sources and label.
  • Missing is never zeroA source that isn't connected shows as a labeled gap, never as $0.
  • Graded evidenceEstimates carry a likely range and a grade: tested, supported, tentative or platform claim.
  • Read-only, alwaysLovelace never writes to your ad accounts or your store.

What it answers

The three questions behind every budget decision

Platform dashboards each grade their own homework. Lovelace puts every channel, storefront and cost on one set of definitions, so the answers hold up in front of your finance team and your board.

  1. What does the next customer cost?

    For each channel, the cost of one more new customer at today's spend. Not the average, and not the platform's claim. Every figure comes with its likely range and an evidence grade.

  2. How fast do customers pay you back?

    Contribution per new customer after product cost, shipping, fees and returns, month by month, against what you paid to acquire them. That gives payback in months and the most a customer can cost to pay back in time.

  3. Where should the next dollar go?

    Scenarios show what a plan buys and its chance of paying back on time before you commit. Budgets and pacing keep the month on plan, channel by channel.

Features

Marketing mix modeling

A mix model that has to pass its checks

Lovelace's mix model is Bayesian and counts new customers, not revenue, so subscription renewals and repeat orders are never credited to ads. It learns how long each channel's effect carries over and where its returns start to fall off.

Results from experiments you run, such as a geo holdout or a staggered restart, go straight into the fit as measurements.

Illustrative numbers Drawn for this page in the style of Lovelace's channel chart: each channel's next-customer cost, its middle half and likely range, against the most a customer can cost and still pay back within 6 months.
  • Checked before anyone sees it

    Every fit faces blocking checks: assumptions written down before the data, a sampler that converged, and forecasts of held-out weeks that land inside their range and beat a model with no media at all. A run that fails one stays internal.

  • Graded, not oversold

    Each estimate carries a grade: A tested, B supported, C tentative, D platform claim. When two channels rise and fall together and the data can't split them, Lovelace says so and names the test that would.

  • Platform claims stay claims

    Platform-reported conversions, sessions and traffic never enter the model. Lovelace shows platform claims beside the modeled numbers, labeled as what they are.

Growth economics

What a customer is worth, and when they pay you back

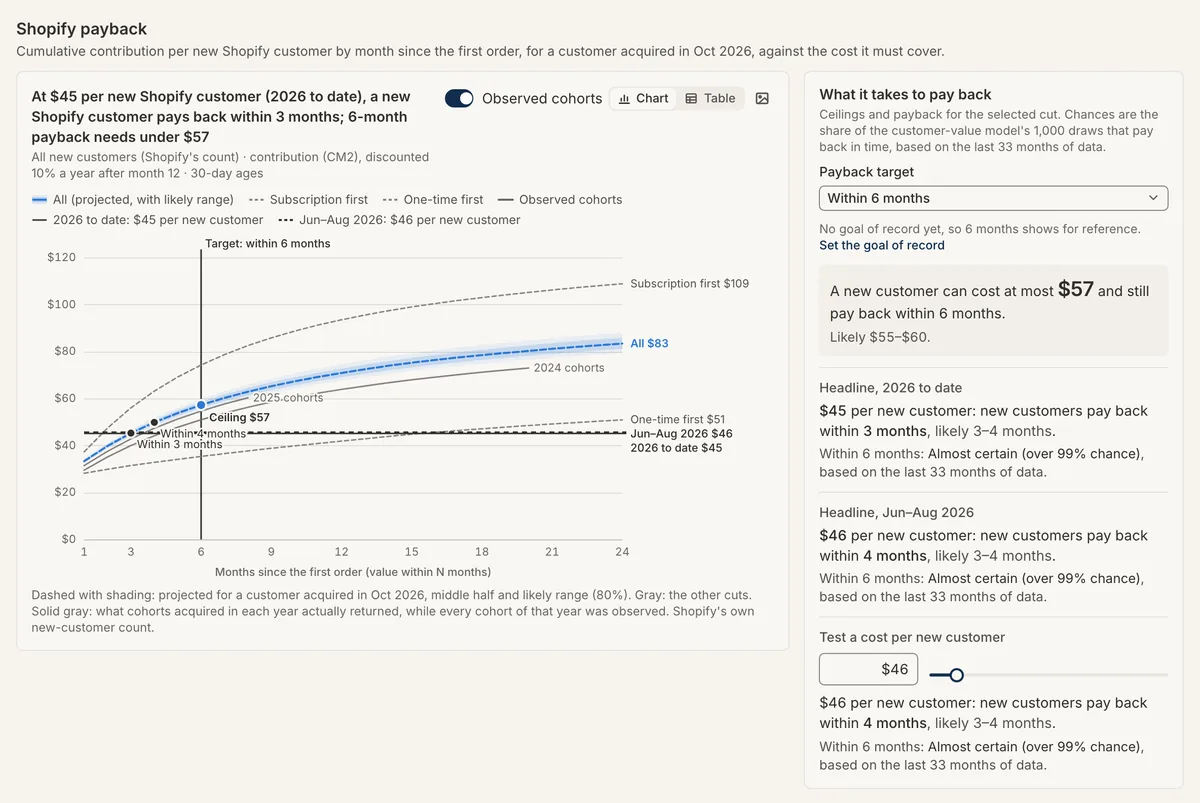
Lovelace values every new customer in contribution: net sales and shipping charged, minus product cost, fulfillment and postage, payment and app fees, and returns. Cohorts are read by the month customers arrived and split by subscription-first and one-time-first, so payback is measured over the customer's life, not on the first order.

The Shopify payback chart: cumulative contribution per new customer by month since the first order, with projected and observed cohorts, subscription-first and one-time-first curves, and lines for spend per new customer. A side panel states that a new customer can cost at most $57 and still pay back within 6 months, likely $55 to $60, and lets you test a cost per new customer.
Synthetic demo data Contribution per new customer over time against what it cost to acquire them, with the 6-month ceiling and the chance of paying back in time. Scroll sideways to read it.
  • Ceilings you can steer by

    The most a new customer can cost and still pay back within 3, 6, 12, 18 or 24 months, each with its likely range, so a cost target comes from your own customers.

  • A cost ledger with provenance

    Costs are dated and sourced. A cost you haven't confirmed is marked assumed on every number it touches, and an unknown cost is listed, never counted as $0.

  • One set of definitions

    Who counts as a new customer, which days and weeks a number covers, and which spend is in a total are written down and versioned, so a tile, a table and a briefing always agree.

Shopify plus Amazon

Each storefront on its own terms, then the whole business

Shopify and Amazon count new customers differently, so Lovelace keeps them apart before it adds them up. Shopify counts a first order, net of gifting and draft orders wherever the data allows, and says on screen when it can't. Amazon counts a first-ever purchase in Amazon Marketing Cloud's purchase data, looking back up to five years. The portfolio adds the two as storefront entries and says so on the screen.

What counts as a new customer. Shopify: first paid order ever on Shopify; gifting, $0 sample and draft-order first orders don't count. Amazon: first-ever purchase in Amazon Retail Purchases, looking back up to 60 months. Portfolio: Shopify plus Amazon, storefront entries, not unique people.
Synthetic demo data The definitions Lovelace shows beside every storefront view. Scroll sideways to read it.
  • Payback follows the storefront

    Each storefront's media prices its own customers. Amazon Ads is costed against Amazon's new customers, never Shopify's, and the portfolio counts every paid dollar once.

  • Retail support kept apart

    Spend that supports a retailer's shelf sits on its own labeled line, outside the portfolio and every cost per new customer, so it never inflates or hides acquisition cost.

  • Privacy limits respected

    When Amazon hides small counts for privacy, the hidden volume is shown and labeled. A number it affects becomes a stated lower bound, never a guess.

Scenarios, budgets and pacing

Plan the spend, then keep the month on plan

Scenarios start from a goal, such as the most new customers while paying back within 6 months in at least 80% of outcomes, and suggest a mix inside your guardrails. Each channel shows its next-customer cost and grade beside its slider, and spend beyond anything a channel has had is marked as extrapolation.

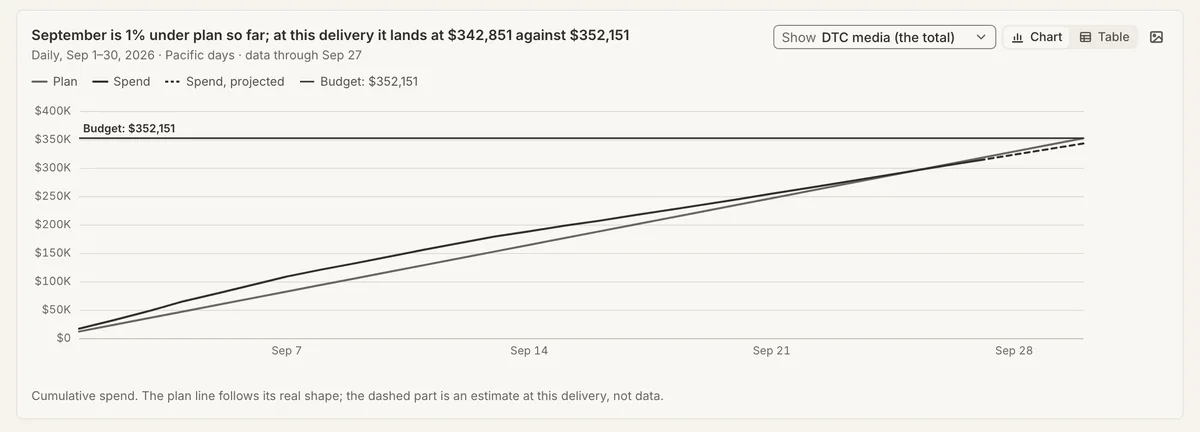
Budgets hold the media plan by channel and week, with tools for heavy-ups, pulses and dark weeks, saved versions and a plan of record. Pacing compares actual spend with the plan at every refresh and opens with what to change today.

A pacing chart titled: September is 1% under plan so far; at this delivery it lands at $342,851 against $352,151. Cumulative daily spend for September against the plan and the month's budget, with the last days projected as a dashed line.
Synthetic demo data Spend against plan for a month, and where the month will land at this delivery. Scroll sideways to read it.
  • People make the change

    Lovelace never touches a budget. Your team changes it in the platform, and Lovelace confirms it from the data on the next refresh.

  • Recommendations with evidence

    Recommendations reach down to the campaign, ad set, ad and search term. Each names its evidence grade, its method and who acts next, and nothing reaches your team until we review and publish it.

  • Planned around your calendar

    Promotions, launches and holidays sit on one planning calendar beside the plan, so a heavy-up and the sale it supports are planned together.

Studies

Straight answers to the one-off questions

Some questions don't fit a standing screen: did a price change bring in new customers, should a channel keep running through a slow season, what did a holiday push add. A study answers one named question over a fixed window of your data. Pixel & Shelf builds each one, checks its wording against the evidence and walks you through it.

  1. 1A named questionWritten the way your board would ask it.
  2. 2A fixed data windowThe dates it reads, stated up front.
  3. 3The bottom lineThe answer, exactly as sure as the data allows.
  4. 4What it can't sayThe claims the data doesn't support, kept out.
  5. 5The test that would settle itWhat to run next, and what it would show.

The parts of every study. No data shown.

Data connections

Connected read-only, refreshed on a schedule we agree with you

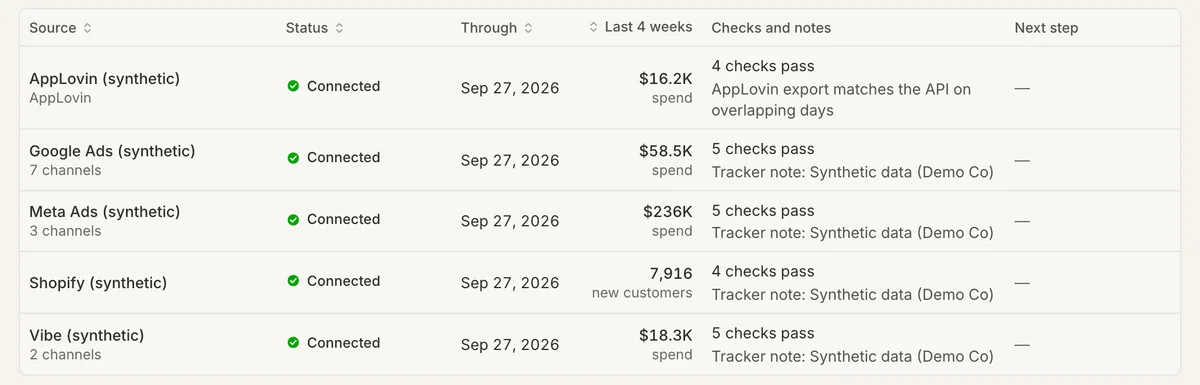
Lovelace reads Shopify, Meta, Google Ads, TikTok, Snapchat, AppLovin, Vibe and Klaviyo, Amazon Marketing Cloud exports, and podcast schedules with their tracking exports. Anything without a connection, such as influencer fees or a smaller ad platform, can be uploaded or entered by hand.

The Data screen's connected sources table, listing each synthetic source with its status, the last day it covers, its last four weeks of spend or new customers, how many checks pass, and the next step.
Synthetic demo data Each source's status, the last day it covers, its last four weeks and its checks. Scroll sideways to read it.
  • Re-checked at every refresh

    Each refresh re-reads the recent days platforms are still revising, rebuilds and runs its checks, and publishes only when every check passes. Otherwise it holds, and we find out why.

  • A late source holds the date

    Numbers run through the last day every required source fully covers, so a late source never shows up as a quiet zero in a total.

  • Gaps that name an owner

    A source that isn't connected yet says what it would add and who acts next, and totals leave it out by name until it arrives.

Access and presentation

Built for the room where decisions get made

Your team gets its own login to the same numbers we work from, and the monthly meeting runs from Lovelace instead of a deck that was out of date the day it was made.

Secure client access

Your team signs in through Cloudflare Access with a one-time code sent to an approved work email, then a code from their authenticator app. Anything that doesn't come through that door is refused.

  • Roles for executives and for operators
  • An access log of who opened your workspace and what changed, which nobody can edit
  • Each brand in its own workspace, isolated at the database
  • Client views show only runs that passed their checks and were published

Presentation mode

Briefings replace the deck. Slides are built from templates and frozen to one data snapshot, with speaker notes and the decisions you record. A pre-flight check confirms every number has its receipt and nothing internal reaches a client slide.

We present it full screen in the meeting, and send a PDF with the same numbers.

  • Monthly growth review
  • Kickoff
  • Quarterly plan
  • Experiment readout

Who it's for

Brands that want a straight answer on payback

  • Consumer brands doing $5M to $500M a year, selling on Shopify, with or without Amazon, with spend across several paid channels.
  • Founders and CEOs who need to know whether growth is paying for itself.
  • Finance leads who want contribution and payback, not platform ROAS.
  • Marketing leads deciding where next month's budget goes, and how to defend it.

How an engagement works

From the first call to the monthly meeting

  1. Scope

    We start with a call about your channels, storefronts and the decisions ahead, then scope the work to your brand.

  2. Connect

    You grant read-only access to your store and ad accounts. We agree on definitions with you, such as who counts as a new customer and which costs count, and load your costs and promotion calendar.

  3. First readout

    Your economics come first: what a new customer costs, what they return and how long payback takes. The mix model joins once it passes its checks.

  4. Every refresh, every month

    Data refreshes on the schedule we agree, and each refresh brings pacing and recommendations up to date. Each month we meet over a briefing, record decisions and plan the tests that settle what the data can't.

Pricing

Lovelace by Pixel & ShelfStarts at $1,000/month

Every engagement is scoped to your brand. The price depends on your storefronts and channels, how much history there is to model, and how much testing and meeting time you want. Lovelace is available to brands that work with Pixel & Shelf.

What an engagement can cover

We agree the scope with you. Most engagements include:

  • Your own workspace, with logins for your team
  • Read-only data connections, refreshed and checked on an agreed schedule
  • The mix model and the customer-value model
  • Scenarios, budgets and pacing
  • Recommendations reviewed by Pixel & Shelf
  • Briefings, presented in the room, with a PDF to keep

FAQ

Questions brands ask first

Does Lovelace change anything in our ad accounts or store?

No. Its access is read-only. Recommendations are applied by people in the platform, and Lovelace confirms the change from the data on the next refresh.

What do you need from us to start?

Read-only access to your store and ad accounts, your product and fulfillment costs, and your promotion calendar. Anything without a connection can be uploaded or entered by hand, and a missing piece shows as a labeled gap until it arrives.

Is this attribution?

No. Lovelace doesn't use a pixel or multi-touch attribution. It models new customers from spend over time, calibrates with experiments, and treats each platform's own conversion numbers as claims to compare, not as the answer.

Does the mix model cover Amazon?

Today the mix model reads Shopify new customers, so its channel estimates are a floor for brands whose ads also send people to Amazon. Amazon has its own economics from Amazon Marketing Cloud, and the portfolio view sets the two storefronts side by side.

What happens when the data can't answer a question?

Lovelace says so. The estimate keeps its wide range and a tentative grade, and the screen names the test that would settle it, such as a geo holdout or a staggered restart.

Is our data shared with other brands?

No. Every brand is its own workspace, isolated at the database with row-level security. Data is never pooled across clients.

Who runs it?

Pixel & Shelf. We connect the data, run the models, review every recommendation and briefing before it reaches you, and walk your team through the results.

How much does it cost?

Pricing starts at $1,000/month. Every engagement is scoped to your brand, so we quote after a short call. Start the conversation.

See what your next customer really costs.

Tell us about your brand, your channels and the decision in front of you. We'll show you how Lovelace would answer it.